Saving laboratory time without compromising accuracy and precision improves turnaround times and sample throughput for fast-moving commodities in mass production environments such as in the iron ore industry. The Zetium spectrometer equipped with a revolutionary ED core is the integration of both WD- and EDXRF technologies in a novel and robust analytical heart known as SumXcore technology.
This unique combination provides mining and metals applications with a number of unique benefits, including spectrum archiving, fast sample screening, shortened measurement times and unexpected element identification during production. This article discusses the reduction in measurement time for the XRF analysis of iron ores using the SumXcore technology.
Instrumentation and Software
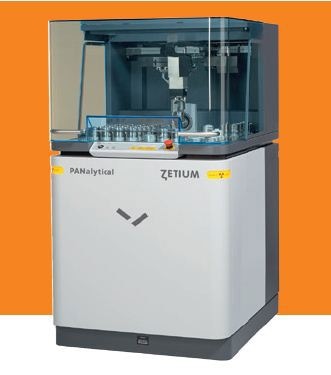
A Zetium XRF spectrometer (Figure 1) equipped with the WD core, ED core, SST R-mAX X-ray tube and a 4kW Rh anode was used to perform the measurements. The WD core consists of the suitable detectors, crystals and collimators to perform WDXRF analyses, and the ED core is equipped with an EDXRF detector that can collect a full EDXRF spectrum in concurrence with WDXRF measurements. The sophisticated SuperQ software package was used for all measurements.

Figure 1. The Zetium XRF spectrometer
Sample Preparation
The sample preparation involved fusing 19 commercially available iron ore standards into 40 mm glass beads using an Eagon 2 bead fusion machine, and using them, calibrations were set up for the 16 oxides listed in Table 1. The calibration results for this application are summarised in Table 1, showing calibration RMS and K factors based on the technology employed for reporting the results.
Table 1. Calibration results
| Oxides |
Compound range |
Calibration RMS |
RMS |
| Min(wt %) |
Max (wt %) |
WD core wt %) |
ED core (wt %) |
WD core (wt %) |
ED core (wt %) |
| Na2O |
0.003 |
0.20 |
0.005 |
|
0.0119 |
|
| MgO |
0.0045 |
3.45 |
0.0366 |
|
0.0348 |
|
| Al2O3 |
0.077 |
10.62 |
0.0472 |
|
0.0287 |
|
| SiO2 |
0.018 |
25.2 |
|
0.0836 |
|
0.0328 |
| P2O5 |
0.018 |
3.69 |
0.0124 |
|
0.0134 |
|
| SO3 |
0.007 |
1.17 |
0.0057 |
|
0.0122 |
|
| K2O |
0.002 |
1.3 |
0.0142 |
|
0.0151 |
|
| CaO |
0.014 |
25.3 |
0.0824 |
|
0.0327 |
|
| TiO2 |
0.0023 |
6.33 |
|
0.0103 |
|
0.0193 |
| V2O5 |
0.005 |
0.93 |
|
0.0071 |
|
0.0143 |
| Cr2O3 |
0.0029 |
0.06 |
0.0022 |
|
0.0062 |
|
| Mn3O4 |
0.01 |
65.94 |
|
0.0189 |
|
0.0203 |
| Fe2O3 |
9.81 |
99.28 |
|
0.1685 |
|
0.0192 |
| CuO |
0.0015 |
0.019 |
0.0023 |
|
0.0069 |
|
| ZnO |
0.0005 |
0.093 |
|
0.0031 |
|
0.0092 |
| As2O3 |
0.026 |
0.22 |
|
0.0019 |
|
0.0037 |
Measurement Conditions
The optimum combination of WD- and EDXRF technologies were used to set up one experiment where the WD core was used to report certain elements and the ED core for other elements without compromising the accuracy and precision. The comparison of the measurement times taken by this unique combination against those of a classical WD-core-only setup is presented in Table 2.
Table 2. Measurement times for the WD core and SumXcore applications
| Oxides |
Measurement time (s) |
| WD core+ |
SumXcore |
| Na2O |
16 |
16 |
| MgO |
6 |
6 |
| Al2O3 |
8 |
8 |
| SiO2 |
4 |
* |
| P2O5 |
10 |
10 |
| SO3 |
24 |
24 |
| K2O |
20 |
20 |
| CaO |
12 |
12 |
| TiO2 |
14 |
* |
| V2O5 |
22 |
* |
| Cr2O3 |
14 |
14 |
| Mn3O4 |
22 |
* |
| Fe2O3 |
2 |
* |
| CuO |
6 |
6 |
| ZnO |
6 |
* |
| As2O3 |
10 |
* |
| Total measurement time: |
196 |
116 |
| Overhead time: |
55 |
42.5 |
| Total analysis time: |
251 |
158.5 |
| Time saving with SumXcore |
36.9 % |
+ peak + background/s where appropriate
* measured while WD core measurements were in progress
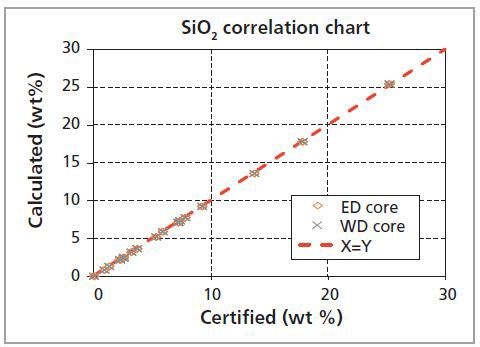
The WD core and ED core were compared for all elements of interest in order to identify the optimum combination. Figure 2 illustrates a comparison for SiO2, graphically comparing the calculated silica (SiO2) concentrations obtained from the WD core against the ED core measurements. Repeating the process led to an experiment involving the measurement of nine compounds with the WD core and seven compounds with the ED core.

Figure 2. WD core vs. ED core calculated SiO2 concentrations
Results
Table 2 shows the advantage of shortening the time for each measurement by 37%, using the capability of the ED core to measure multiple elements as well as the capability of the WD core to measure individual elements. This, in turn, increases the sample throughput from 106 to 161 samples per shift of 8 hours at continuous operation that includes the sample-loading time.
Although the reduction in measurement time provides a significant contribution towards time savings in this application, the reduction in overhead time, which is the time needed for changing collimators filters and crystals in WD core channels, also makes a small contribution. In the case of measuring a large number of elements, with largely varying conditions on the WD core, the overhead time becomes a major contributor.
Table 3 summarises the accuracy and precision that can be achieved in the measurement of a certified iron ore standard JSS 830-3. The resulting concentration values are in good agreement with the certified values, and the application yields reliable and reproducible results. Using the SumXcore technology the analysis times can be reduced by up to 50%.
Table 3. Accuracy and precision of the SumXcore application (JSS 830-3)
| WD/ED |
Element/ compound (wt %) |
Certified conc. (wt %) |
Measured conc. (wt %) |
Repeatability n = 22 (wt %) |
| ED |
SiO2 |
2.26 |
2.19 |
0.01 |
| TiO2 |
6.33 |
6.34 |
0.006 |
| V |
0.30 |
0.30 |
0.003 |
| Mn |
0.61 |
0.62 |
0.003 |
| Total Fe |
60.57 |
60.52 |
0.039 |
| Zn |
0.075 |
0.075 |
<0.001 |
| As |
* |
* |
* |
| WD |
Na |
* |
* |
* |
| MgC |
2.15 |
2.24 |
0.01 |
| Al2O3 |
2.75 |
2.72 |
0.02 |
| P |
0.124 |
0.124 |
0.001 |
| S |
0.005 |
0.006 |
<0.001 |
| K |
* |
* |
* |
| CaC |
0.68 |
0.71 |
0.003 |
| Cr |
0.018 |
0.016 |
0.001 |
| Cu |
0.011 |
0.009 |
<0.001 |
*not certified/reported
Conclusion
From the results, it is evident that the Zetium spectrometer integrated with the combination of WD- and EDXRF technologies shortens measurement times and yields rapid measurements without compromising analytical performance when compared to using only a single technology in iron ore analysis.
Repeatability is close to the theoretical limit, thanks to the stability of the Zetium spectrometer. As a result sample throughput is significantly improved, which is a key advantage in high-volume industries such as iron ore.
Determination and flagging of unexpected elements in process control and fast sample screening with or without Omnian standardless analysis software are the other advantages of the integration of the ED core.

This information has been sourced, reviewed and adapted from materials provided by Malvern Panalytical - Analytical Instrumentation and Software for X-ray and Related Techniques.
For more information on this source, please visit Malvern Panalytical - Analytical Instrumentation and Software for X-ray and Related Techniques.