Mineral liberation represents an important step in the production of quality mineralogical concentrates from ores. The products or concentrates must have an acceptable degree of purity for the downstream processes in which they will be utilized.
The original mined ore must be processed through comminution i.e. crushing, grinding and classification to release the preferred minerals from it, and through concentration (froth flotation, gravity separation, magnetic separation) to improve the content of minerals to the preferred level.
In order to design, analyze, and optimise the process, information is required on the extent to which the mineral grains have been liberated from the accompanying gangue minerals.
INCAMineral Software
Oxford Instruments’ INCAMineral software is an add-on to INCAEnergy, which uses the functionality of INCAFeature to perform efficient study of the degree of mineral liberation.
INCAMineral integrates image analysis of samples and X-ray analysis of their chemical composition and data processing to ascertain the individuality of grains and their degree of liberation.
The integration of INCAMineral software with a large-area X-Max SDD detector allows a scanning electron microscope (SEM) to conduct mineral liberation analysis to greater accuracy and performance than a dedicated system, while simultaneously retaining the flexibility to conduct the entire imaging and analytical tasks that a SEM is capable of, without removing the sample from the chamber. Figure 1 shows the workflow of the INCAMineral software.
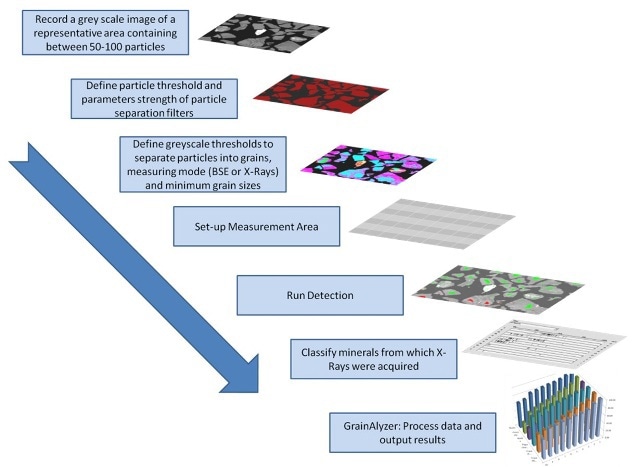
Figure 1. INCAMineral workflow
The INCAMineral software introduces a range of recipes and setup parameters to INCAFeature which are dedicated to mineral grain and particle analysis. The package includes the post-processing program GrainAlyzer, which allows in-depth study of individual grains and yields comprehensive mineral liberation and association reports.
The case studies described below were performed to show the capabilities of the INCAMineral software. The methodology shown in Figure 1 was applied in all cases.
Liberation of Goethite and Hematite
The liberation of hematite was studied from a range of size fractions in a SLon magnetic separation concentrate. Hematite-rich iron ore with accessory goethite was used as the feed material for the magnetic separation. Quartz was the main gangue mineral and the quantity of magnetite was less than 1%.
The liberation of goethite and hematite in the ore was determined from grey-level image analysis, whilst the gangue silicates and accessory sulphides were detected by X-ray analysis. The liberation of quartz and hematite were 77% and 80%, respectively.
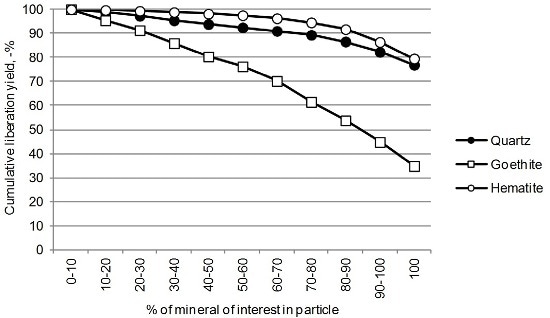
Figure 2. Cumulative liberation yield for hematite, goethite and quartz and association of hematite with other minerals in wt %.
| Mineral |
Liberated |
Binary |
Ternary+ |
Sum |
| Hematite |
71.79 |
8.34 |
10.01 |
90.14 |
| Goethite |
|
1.81 |
3.03 |
4.84 |
| Quartz |
|
1.98 |
1.32 |
3.30 |
| Others |
|
0.40 |
1.33 |
1.72 |
Goethite occurs proximally with hematite and just 35% of goethite occurs as liberated grains in the magnetic concentrate. Figure 2 shows the mode of occurrence and association of hematite with other minerals.
Liberation of Galena and Sphalerite in Flotation Feed and Tails
The liberation of galena and sphalerite were determined by size from flotation feed (FF) and flotation tails (FT). The main goal of this mineralogical process assessment was to differentiate the FF and establish reasons for zinc and lead losses in FT. In FF, the bulk liberation of galena and sphalerite was at a reasonably good level - 77% and 87%, respectively.
Sphalerite is mainly lost to the FT as liberated grains, while galena is lost primarily as fine grained inclusions in gangue silicates. The bulk liberation of sphalerite in FT is 67% and that of galena was a mere 15% (Figure 3).
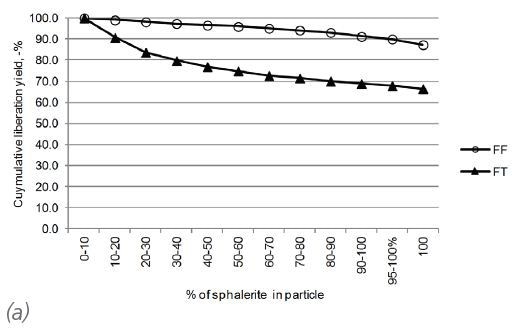
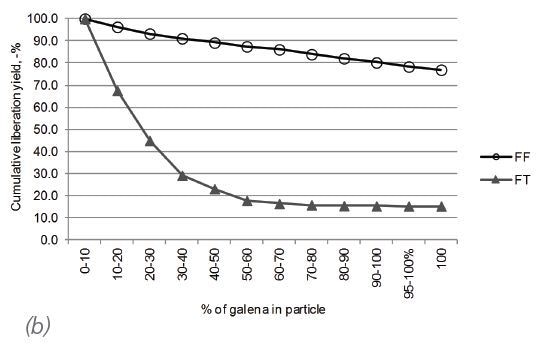
Figure 3. Liberation of a) sphalerite and b) galena in flotation feed (circles) and flotation tails (FT) (triangles), respectively.
Liberation of Chromite
The liberation of chromite was determined from a series of samples with different grain sizes. It was observed that total liberation ranged from 77% to 85%. The grain size reduction of coarse chromite grains increased the degree of liberation only slightly. This is because some chromite grains have small angular silicate inclusions and would require extra fine particle size to release chromite from a texture of this nature.

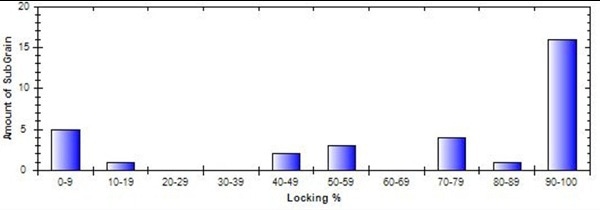
Figure 4. Binary chromite (red) - gangue (grey) – particles with locking distribution data.
The INCAMineral software enables the mode of occurrence of inclusions to be analysed in terms of locking degree even on an individual grain basis. Figure 4 illustrates a chromite grain with silicate inclusions as well as the locking data for each grain in the chromite-silicate particle.
Rare Mineral Scan
The INCAMineral rare mineral scan looks for minerals of interest by means of BSE images at selected grey level threshold values and obtains X-ray spectra and particle property data. This kind of study usually focuses on detecting platinum and gold group minerals from process feeds and tails; however, the method can also be used to scan low to trace element concentrations in sulphides and sulphosalts.
For each located grain, the chemical composition, X-ray spectrum, morphological particle properties and location are recorded and saved. Based on saved data, grains of interest requiring additional analysis can be easily selected and relocated.
The analysed chemical composition as well as on-line classification of rare grains provides significant benefits in process mineralogical studies. Field emission gun microscopes (FEG-SEMs) also allow efficient detection of sub-micron grains.
Conclusion
Using the INCAMineral software with large area SDD devices makes the traditional instrument to deliver similar performance and throughput as a dedicated system. The case studies clearly demonstrate the benefits of using a standard SEM equipped with a large area SDD and INCAMineral for mineral liberation analysis.

This information has been sourced, reviewed and adapted from materials provided by Oxford Instruments Nanoanalysis.
For more information on this source, please visit Oxford Instruments Nanoanalysis.